STM32CubeIDE

STM32CubeIDE can be downloaded here.

Editor

Importing a template

Import the template ZIP archive into the workspace.

Note
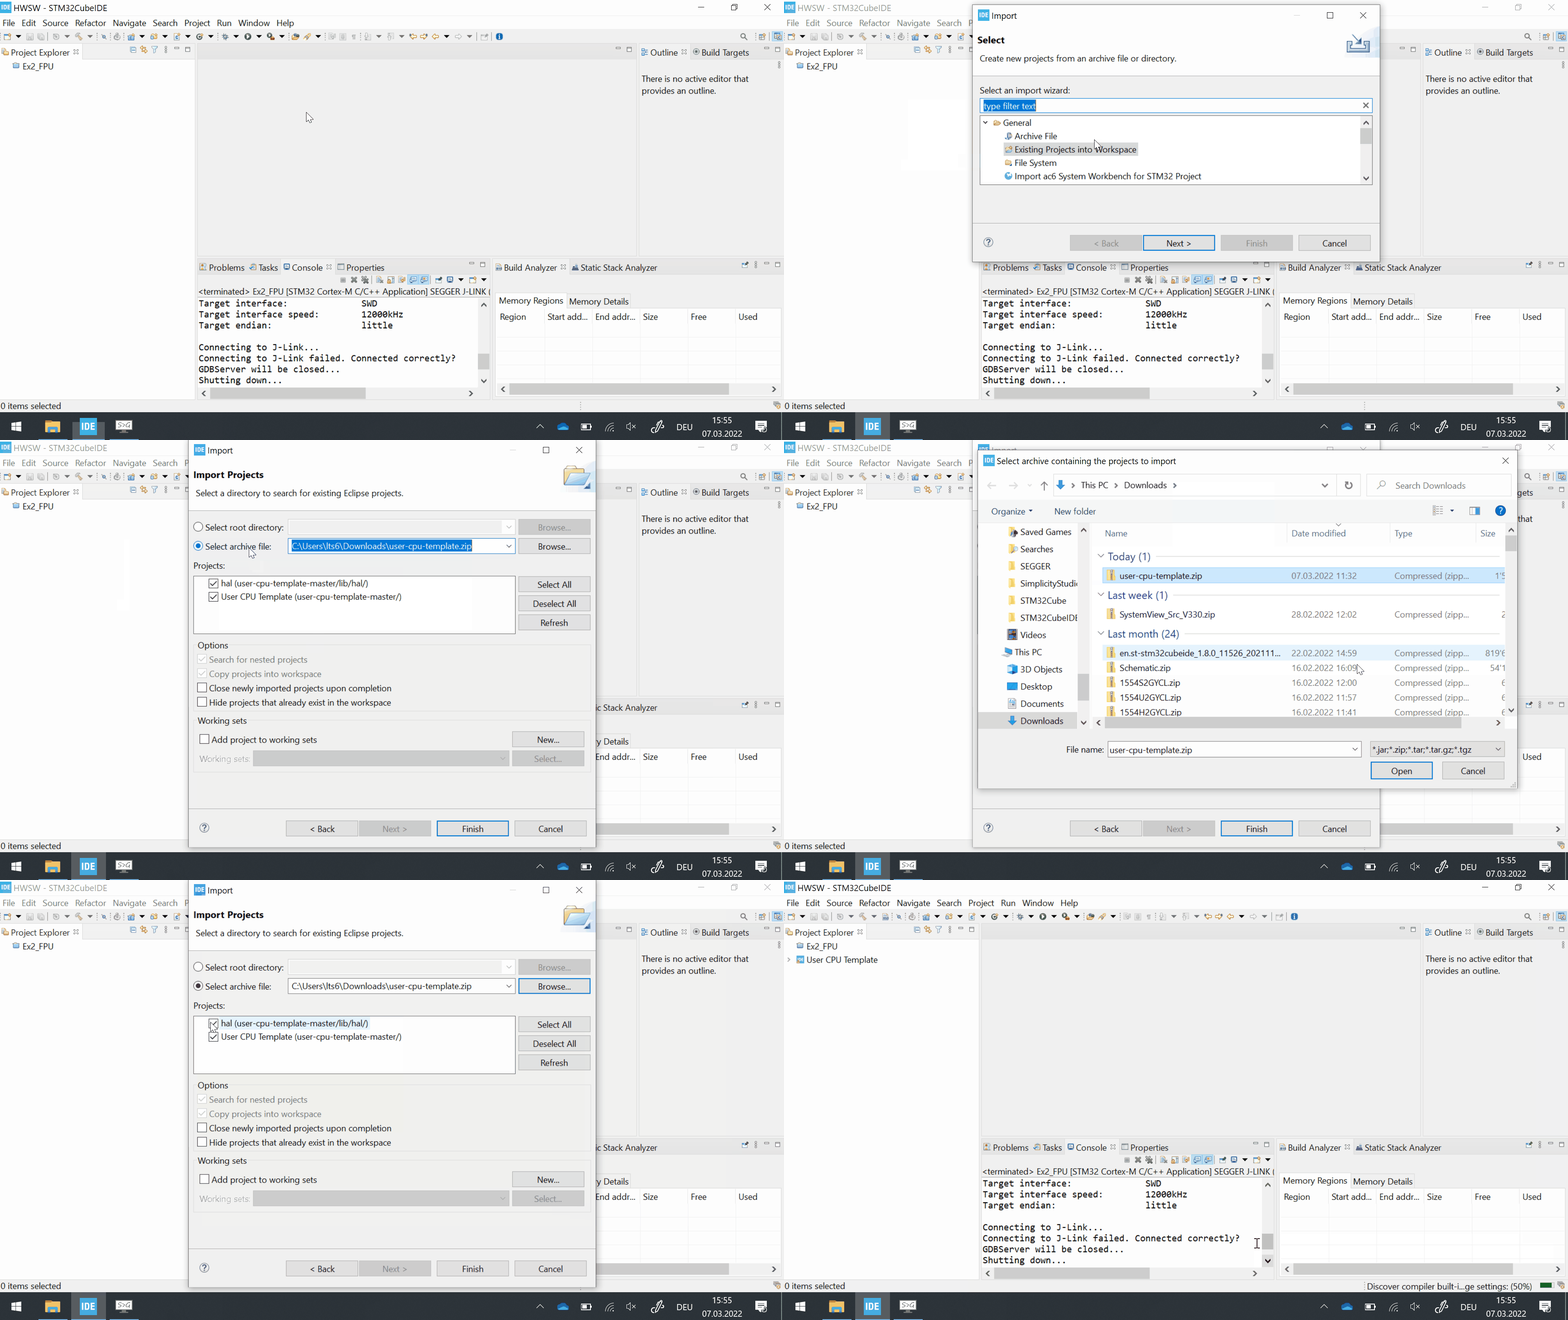
Untick the hal project when using the leguan template.
../_images/cubeide_create_project.gif

Give the project a sensible name and rebuild the index.

Note
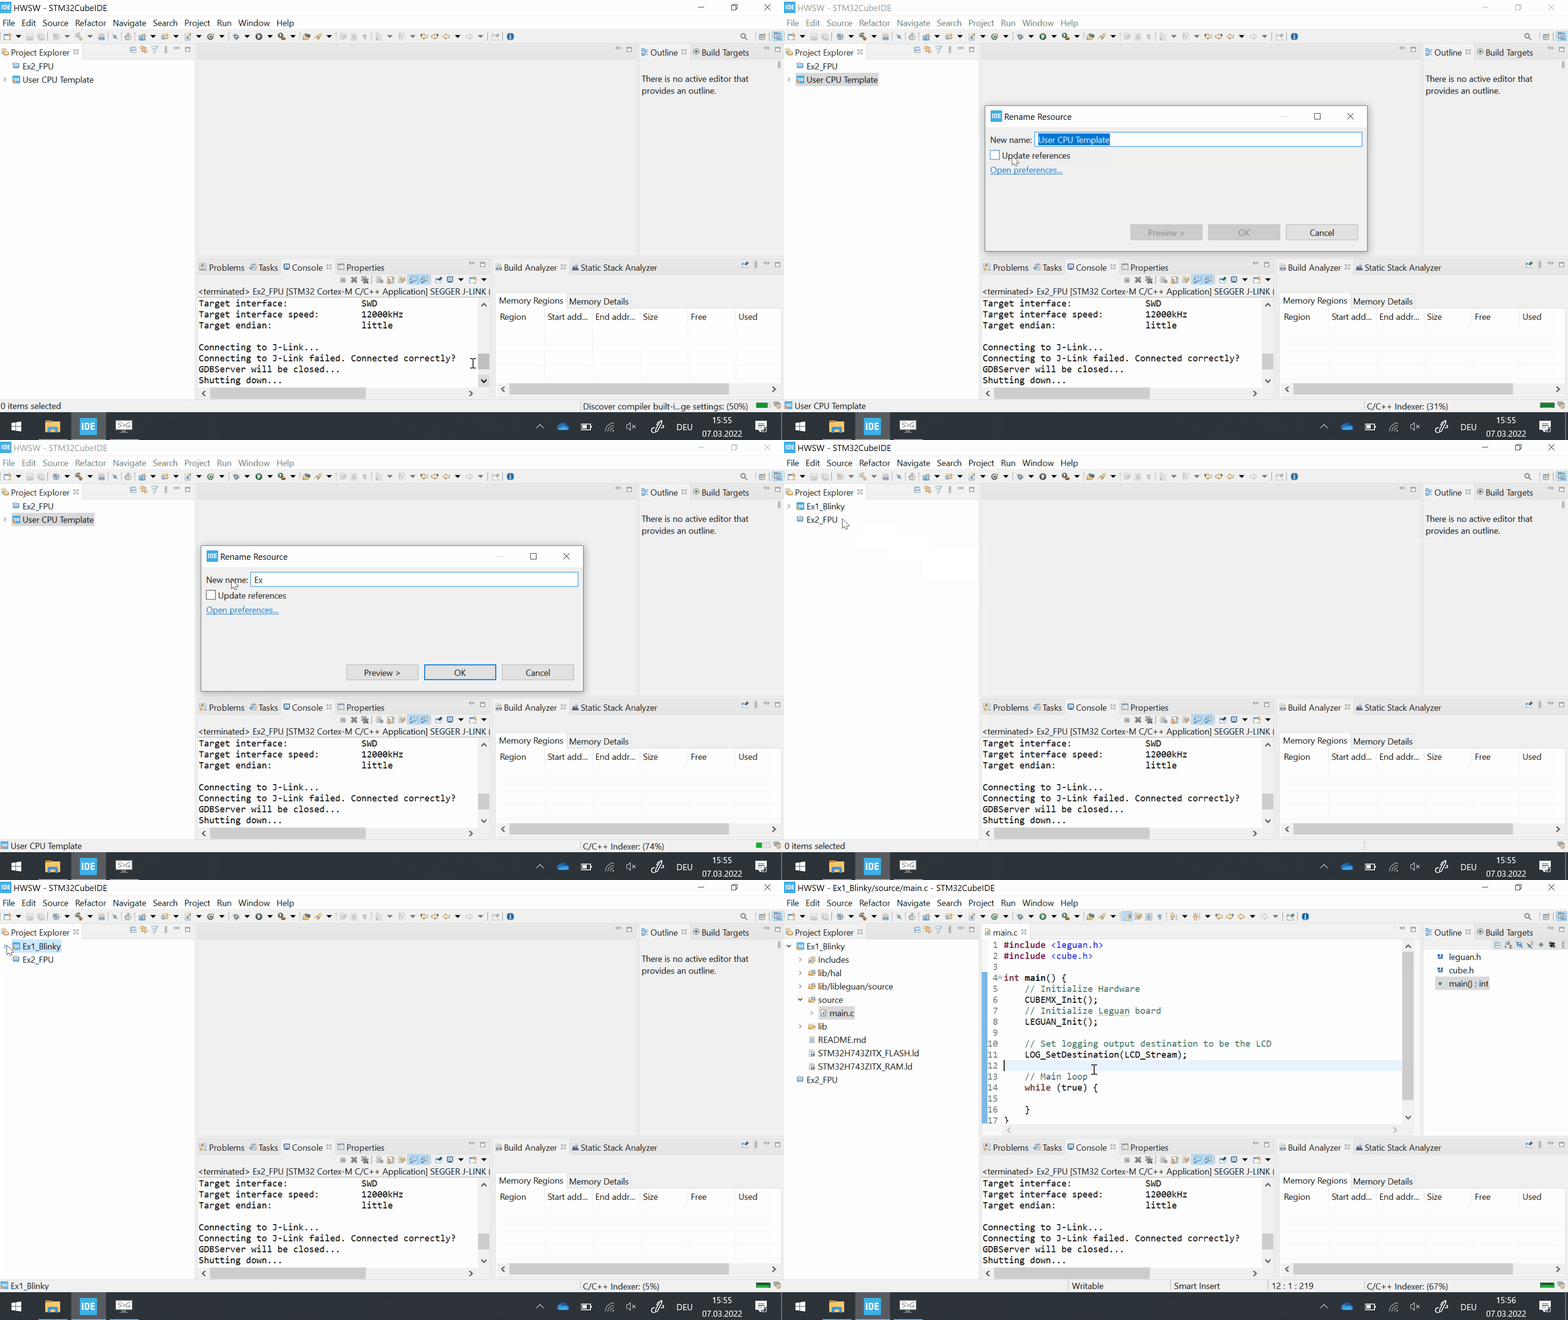
There cannot be multiple projects sharing the same name. Therefore, be sure to close the HAL subproject of the leguan template.
../_images/cubeide_rename_project.gif

Build

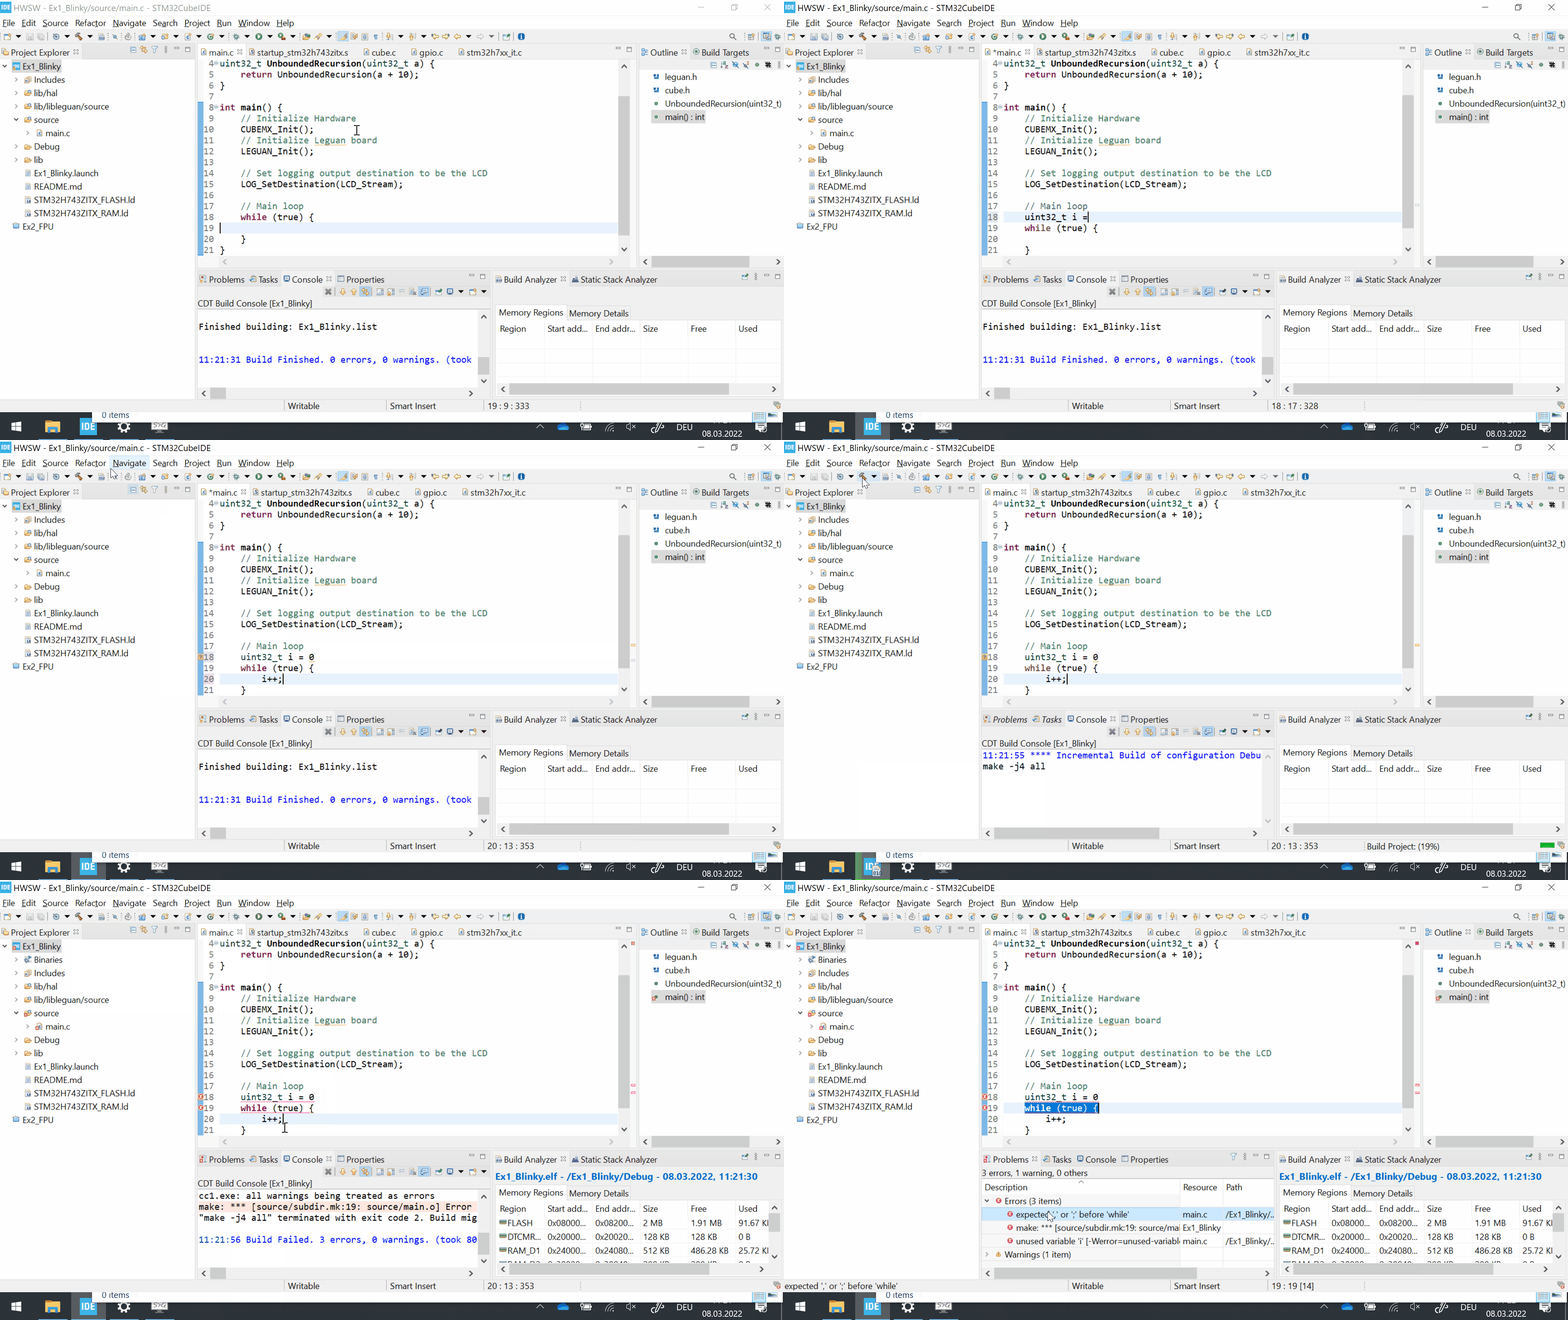
Click the hammer icon to build your project. If the compiler throws an error, open the Errors tab and double [left click] the messages to jump to error source.

Note

The error does not always originate from the line the compiler tells you. This applies in particular to missing ;, { or macros).
../_images/cubeide_edit_build.gif

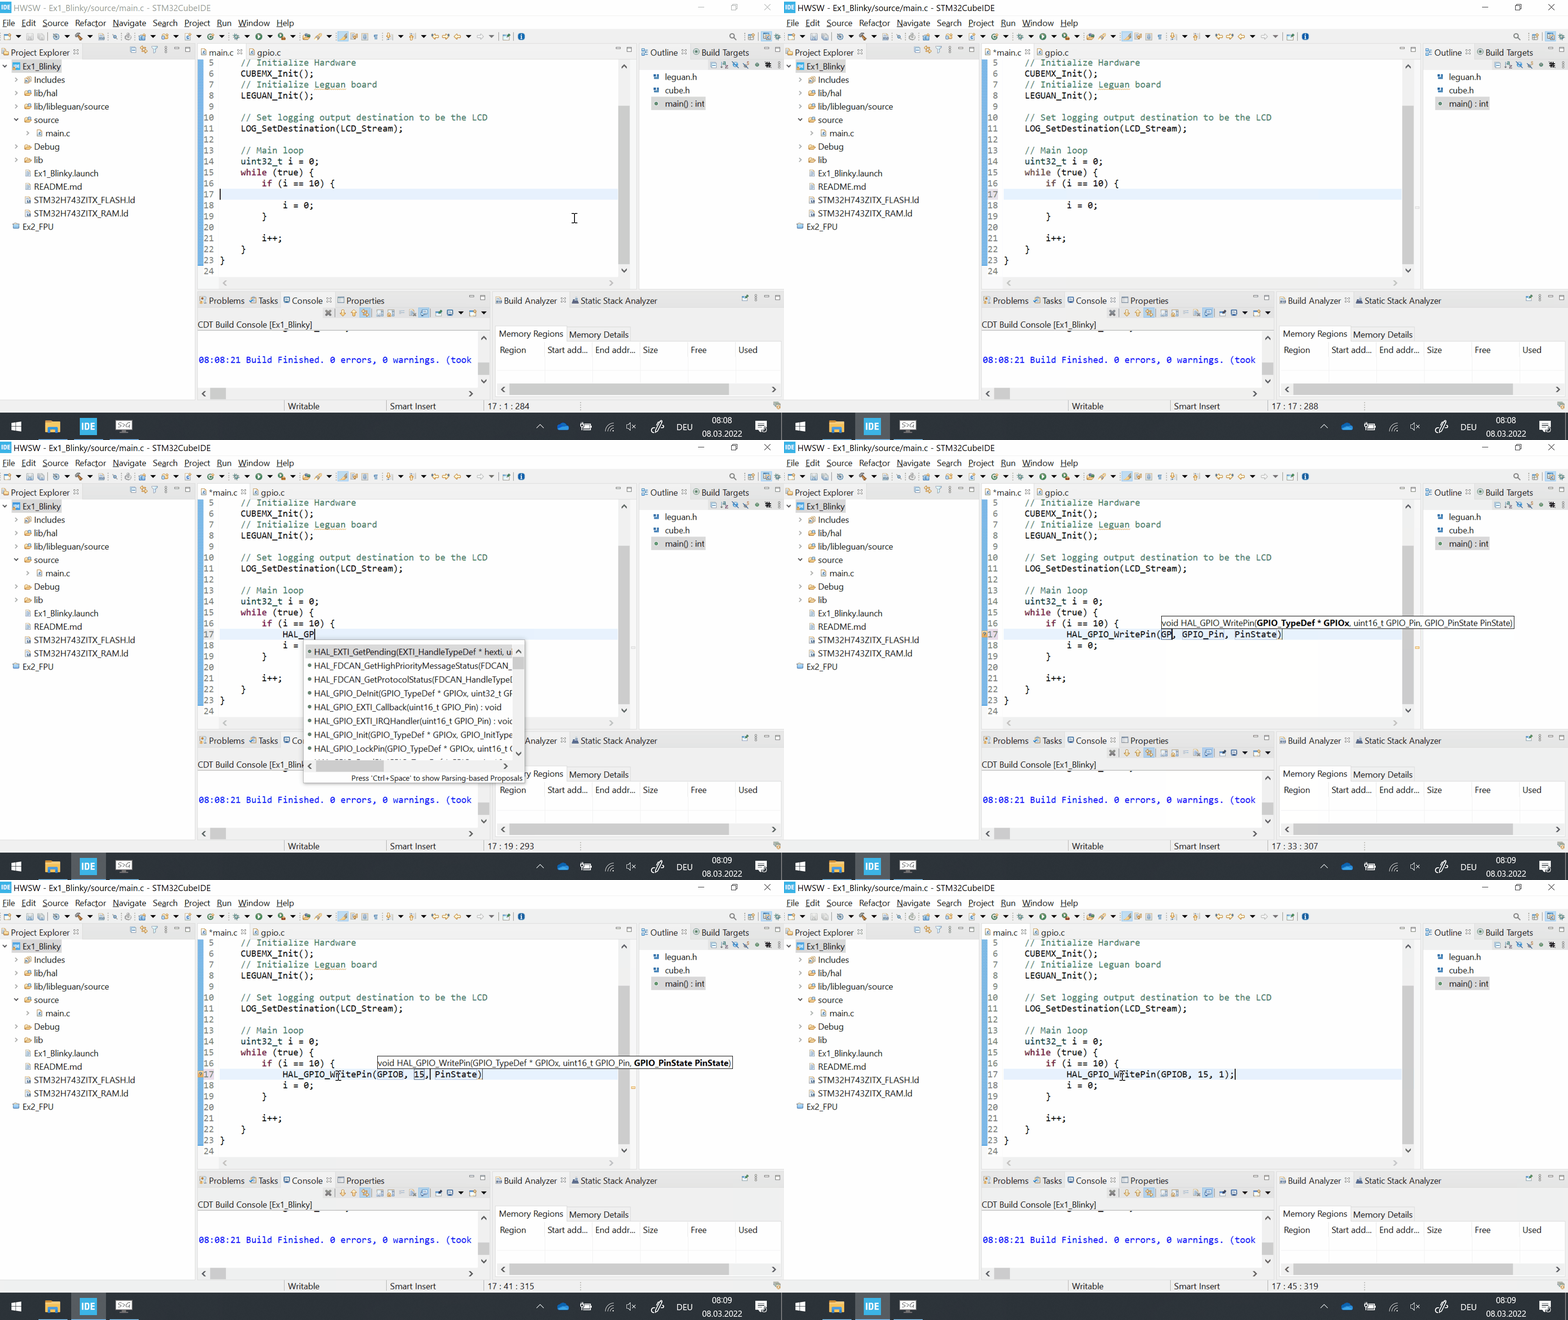
Autocompletion

Press [CTRL] + [space] for autocompletion while typing.

../_images/cubeide_edit_autocomplete.gif

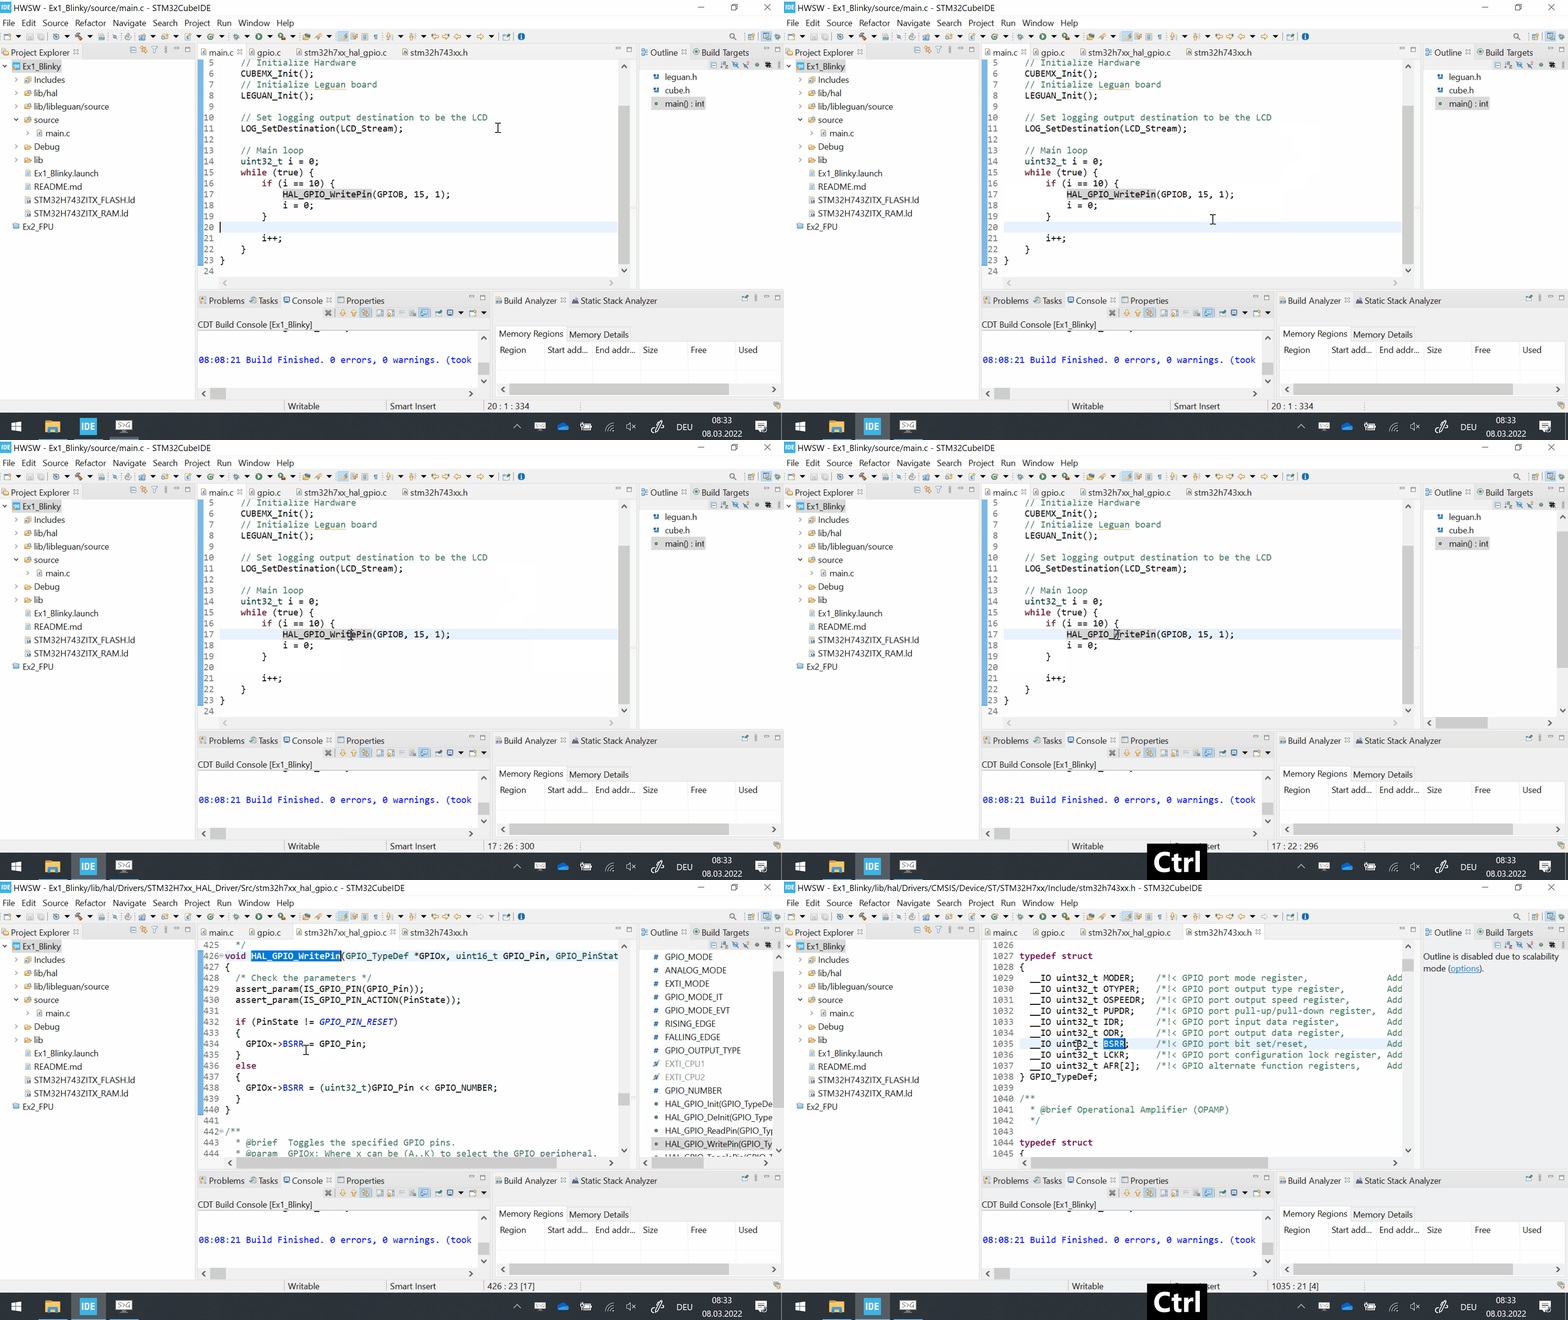
Go to declaration

Open function/type declaration and include by [left click] and holding [CTRL]

../_images/cubeide_edit_ctrl_click.gif

Debugger

Start debug session

Start the debug session by clicking the bug icon. On the first start you will be asked to set up the hardware debugger.

Note
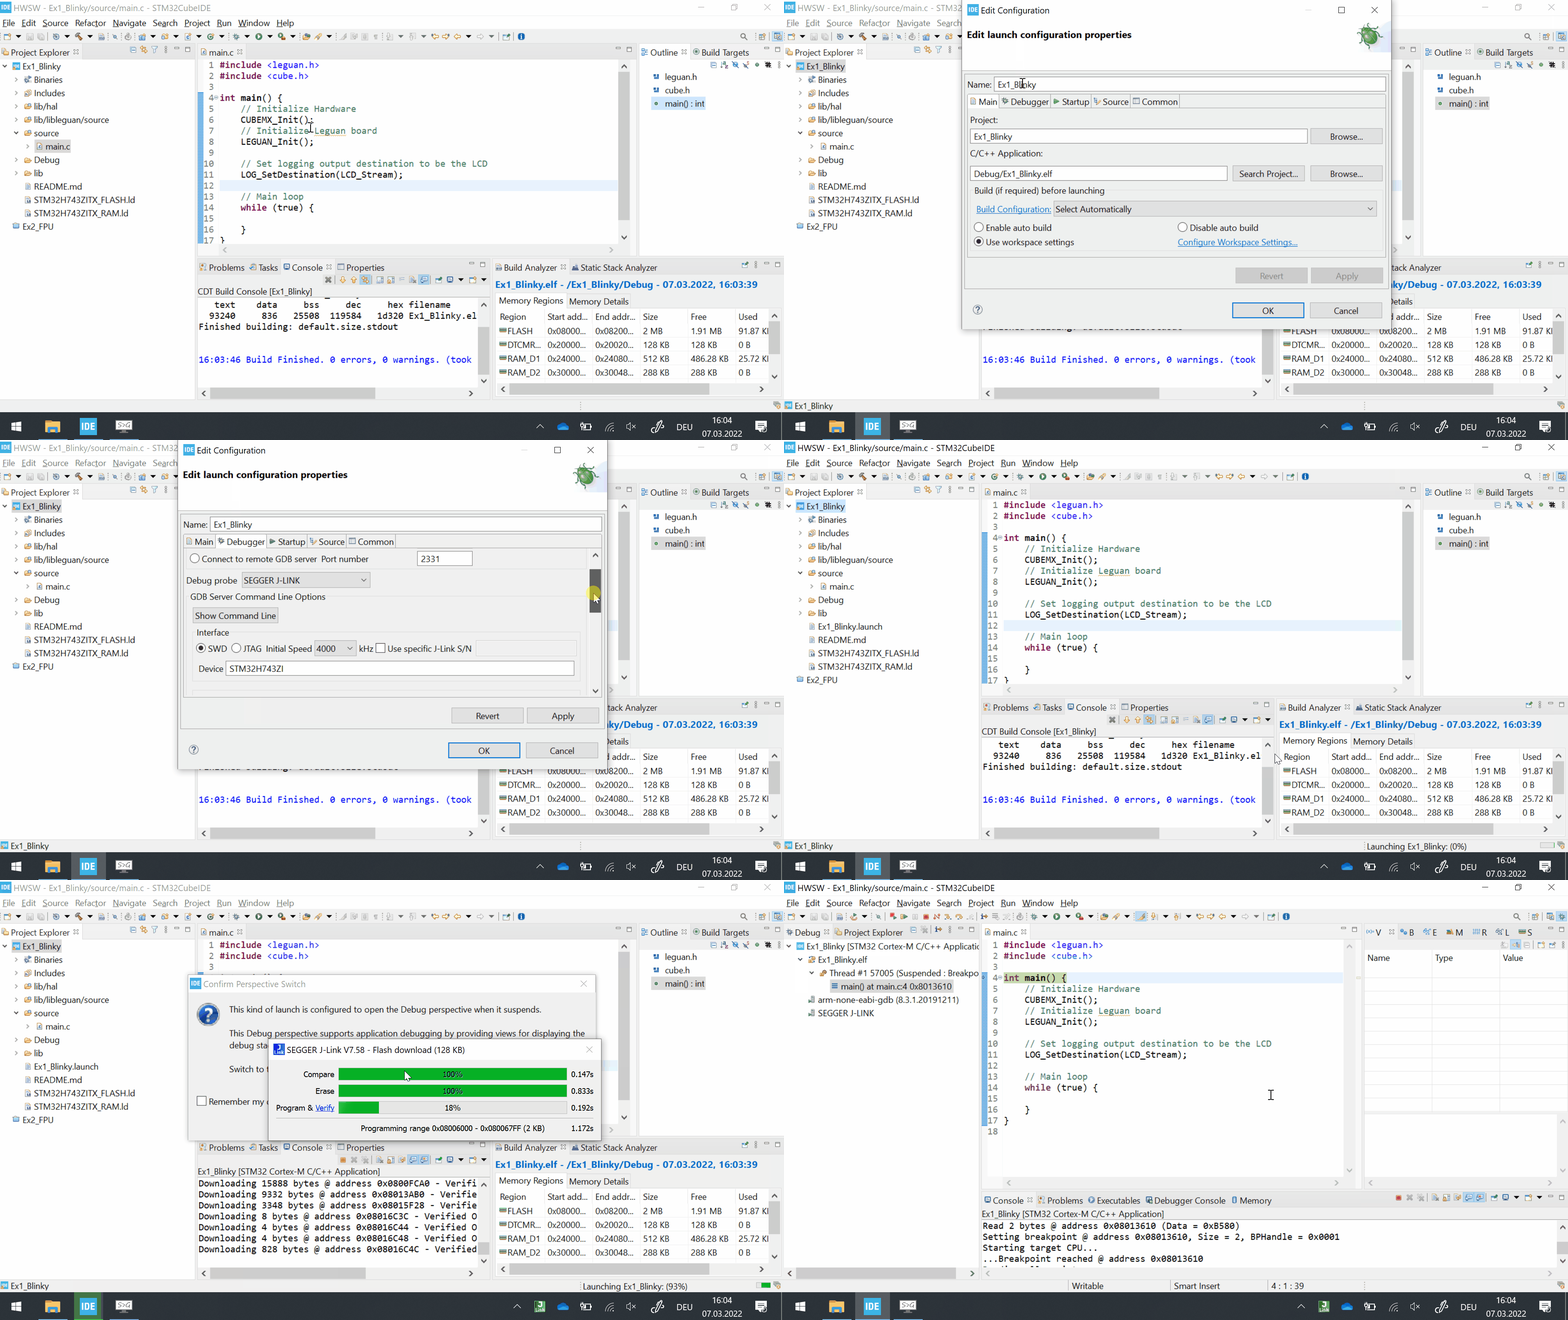
The leguan board features a SEGGER J-Link while ST Nucleo boards use an ST-Link.
../_images/cubeide_debug_start.gif

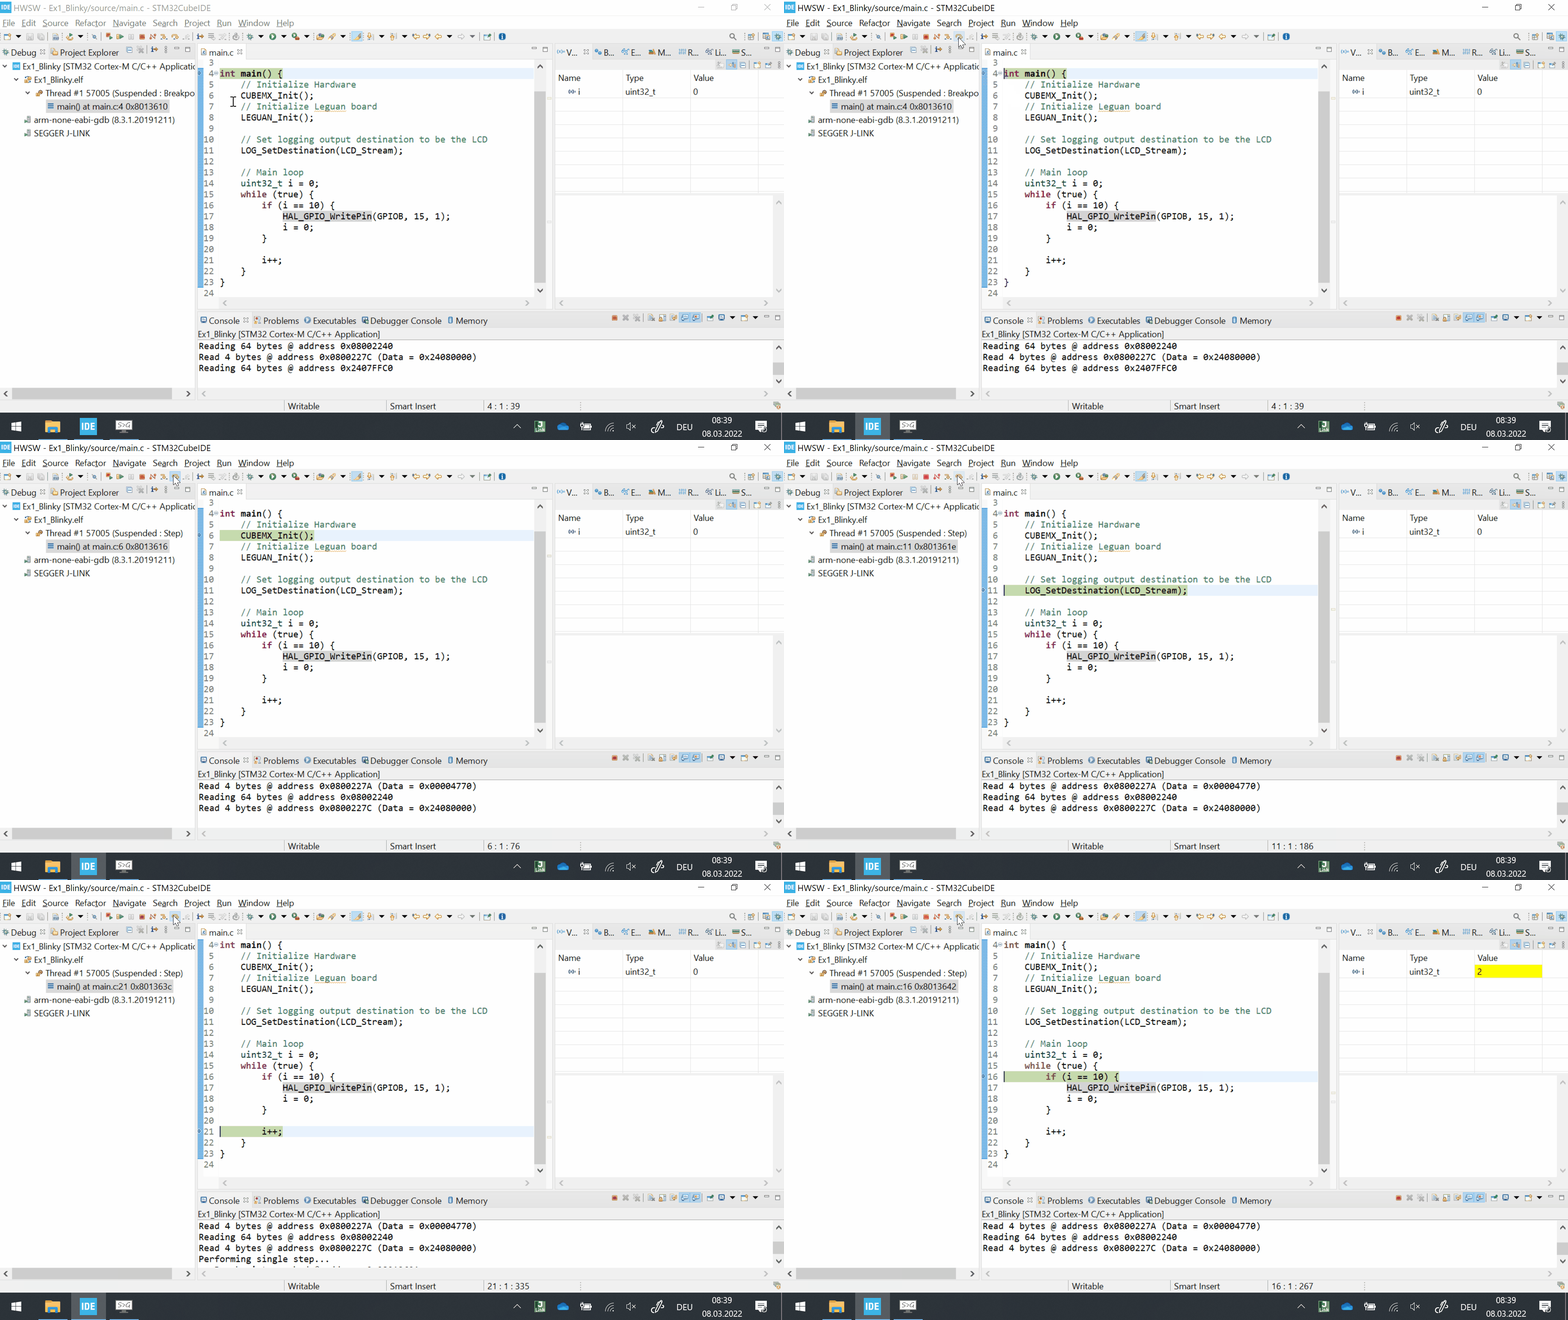
Stepping

There are three manual step operations:
  1. Step over ([F5]) a function

  2. Step into ([F6]) a function

  3. Step out of ([F7]) a function

../_images/cubeide_debug_step_over.gif ../_images/cubeide_debug_step_into.gif

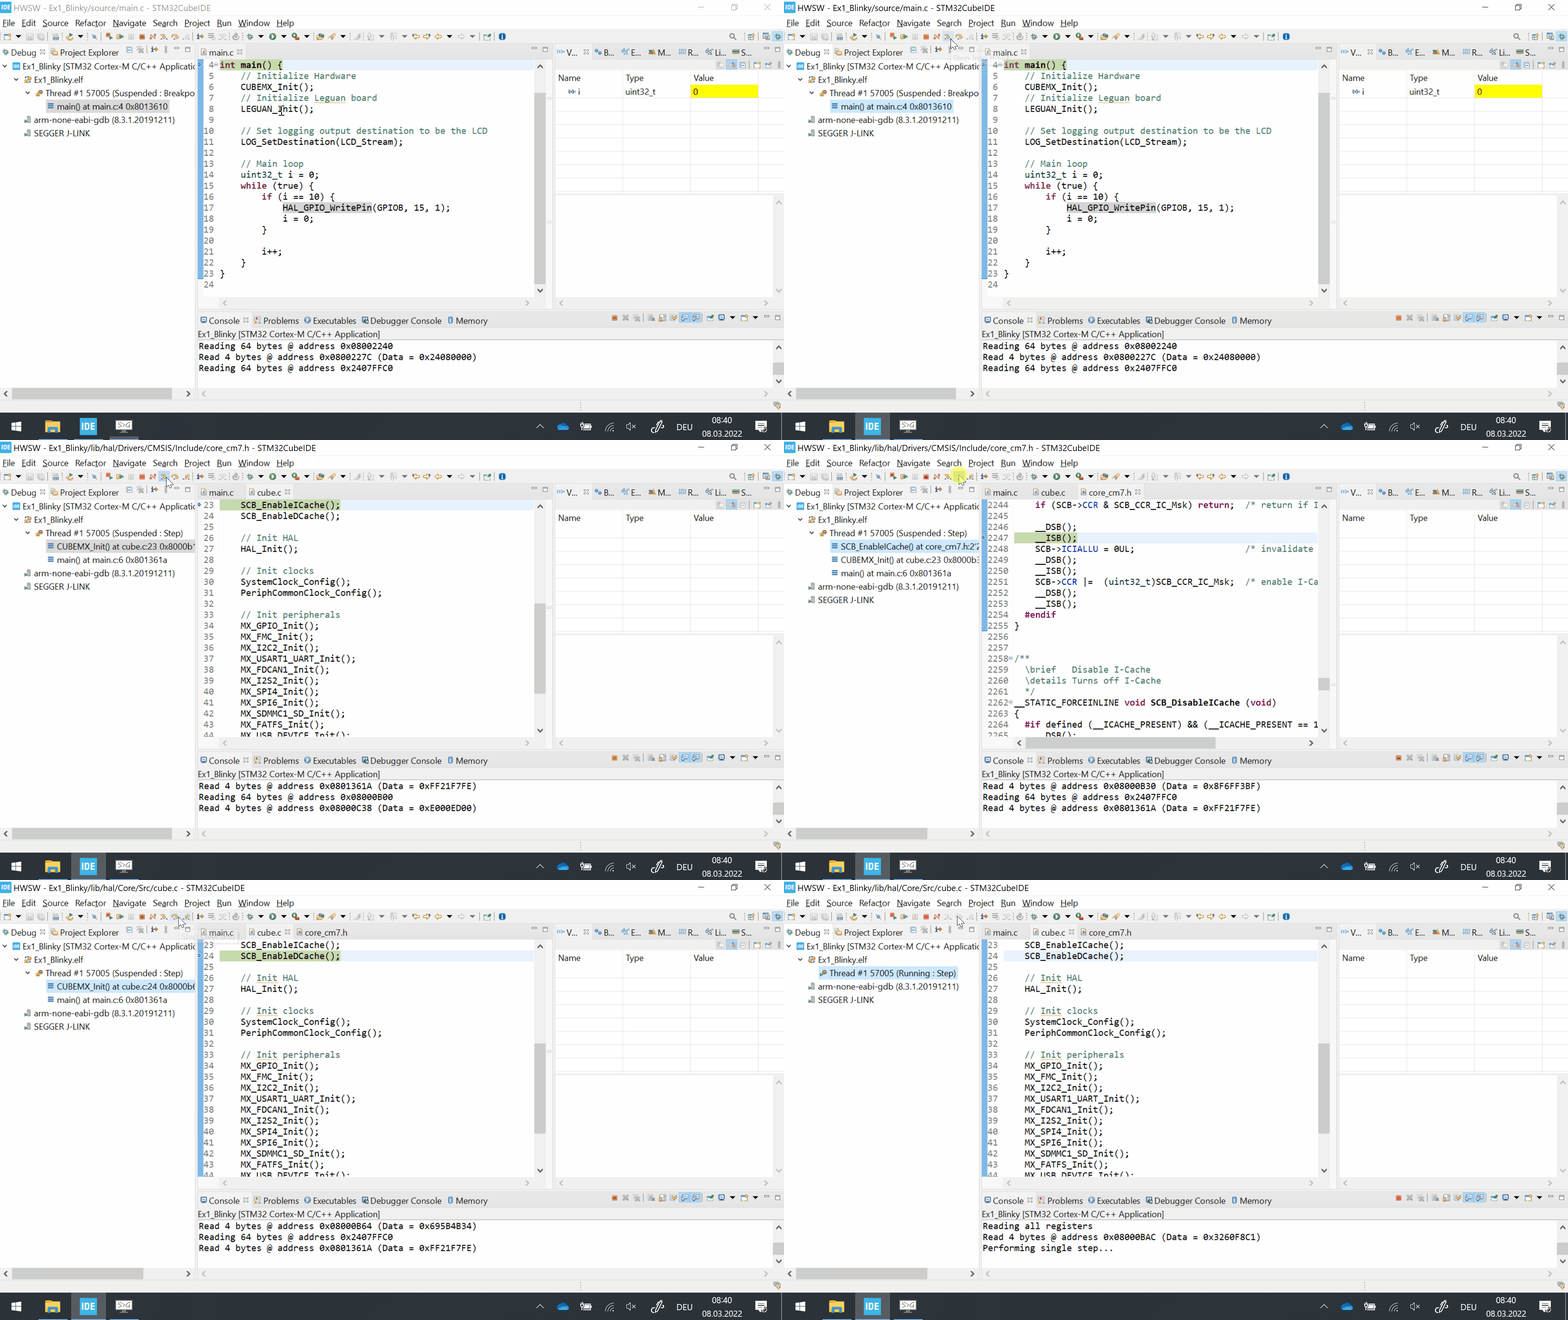
Run and break

You can halt a program on a specific line by double [left click] on the left to the line number (break points are marked by a blue dot).

Click Resume ([F8]) to run the program until a breakpoint is reached.

Note
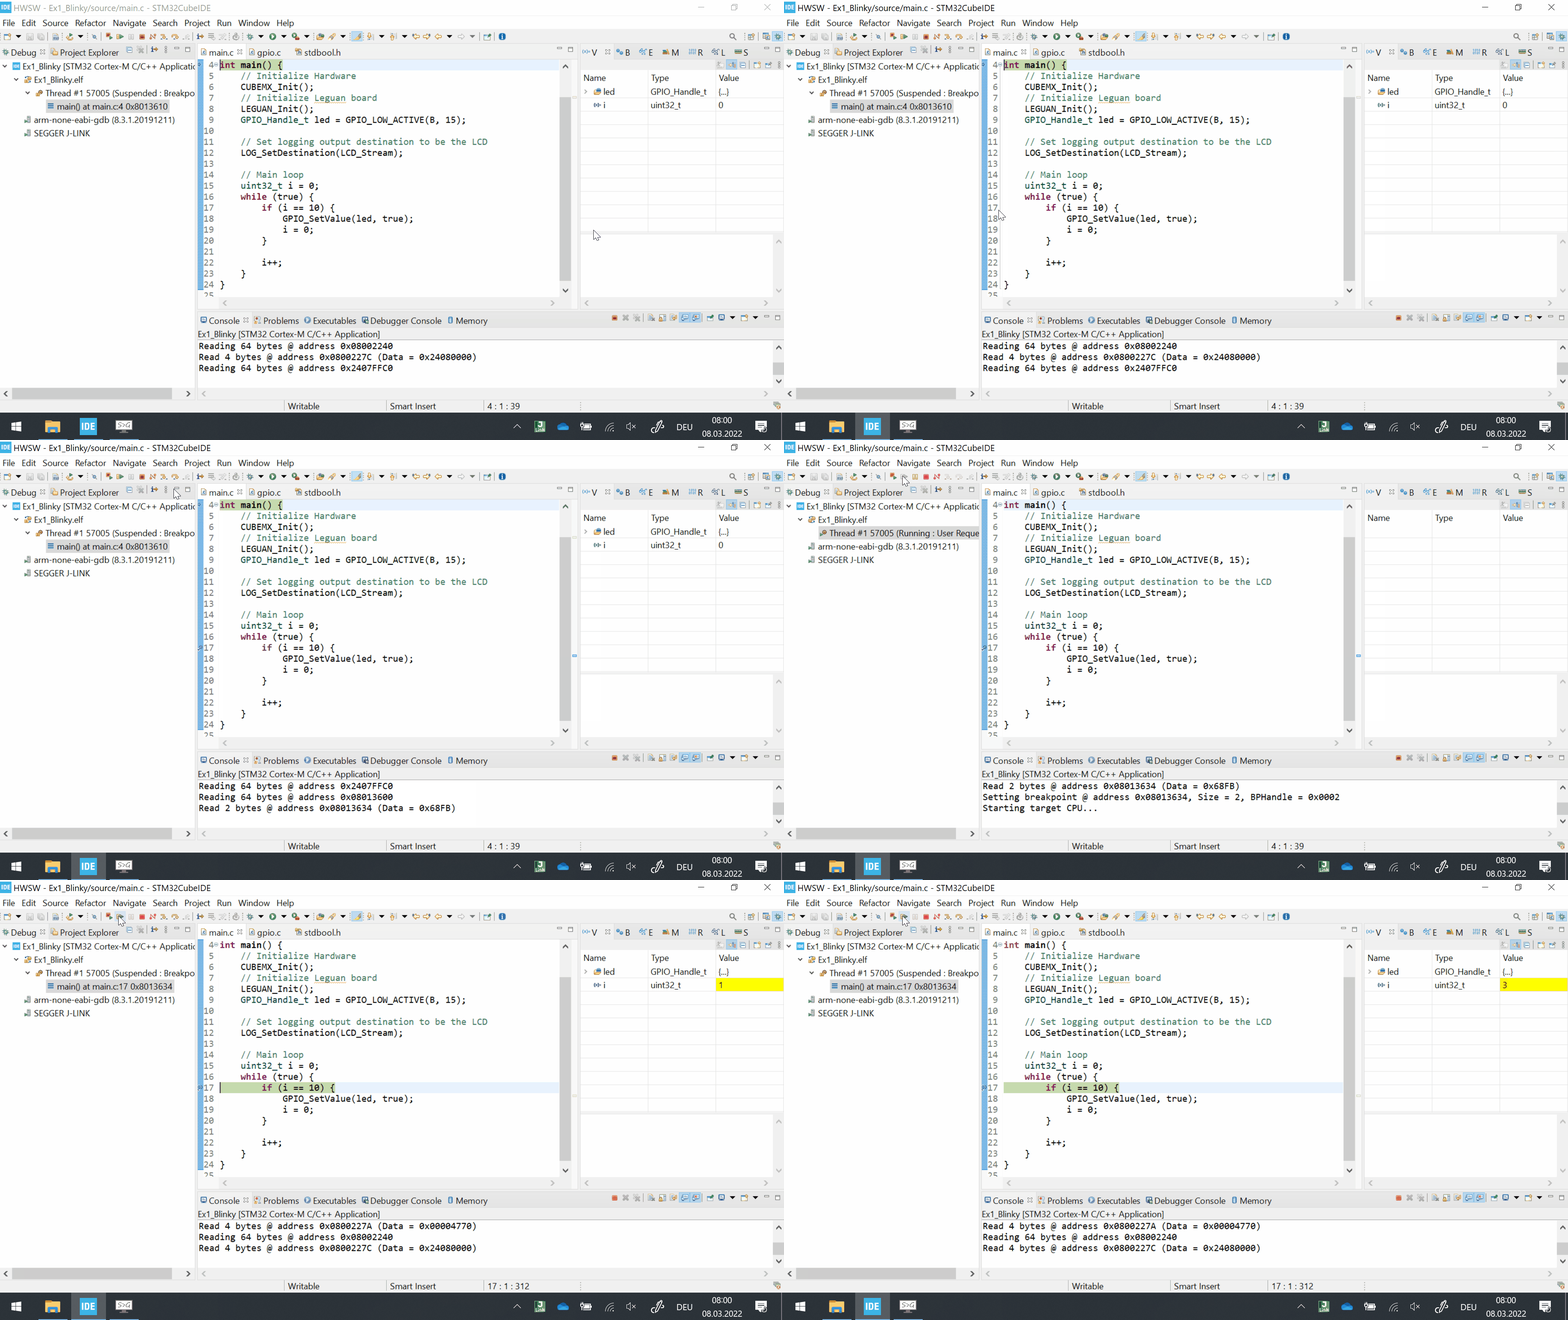
Use Reset chip [..] to start the program from the beginning.
../_images/cubeide_debug_breakpoint.gif

Inspecting variables and registers

Use breakpoints and/or manual step operations to halt the program in the area of interest. Local variables are displayed in the Variable tab or when hovering the cursor over the variable name.

Note
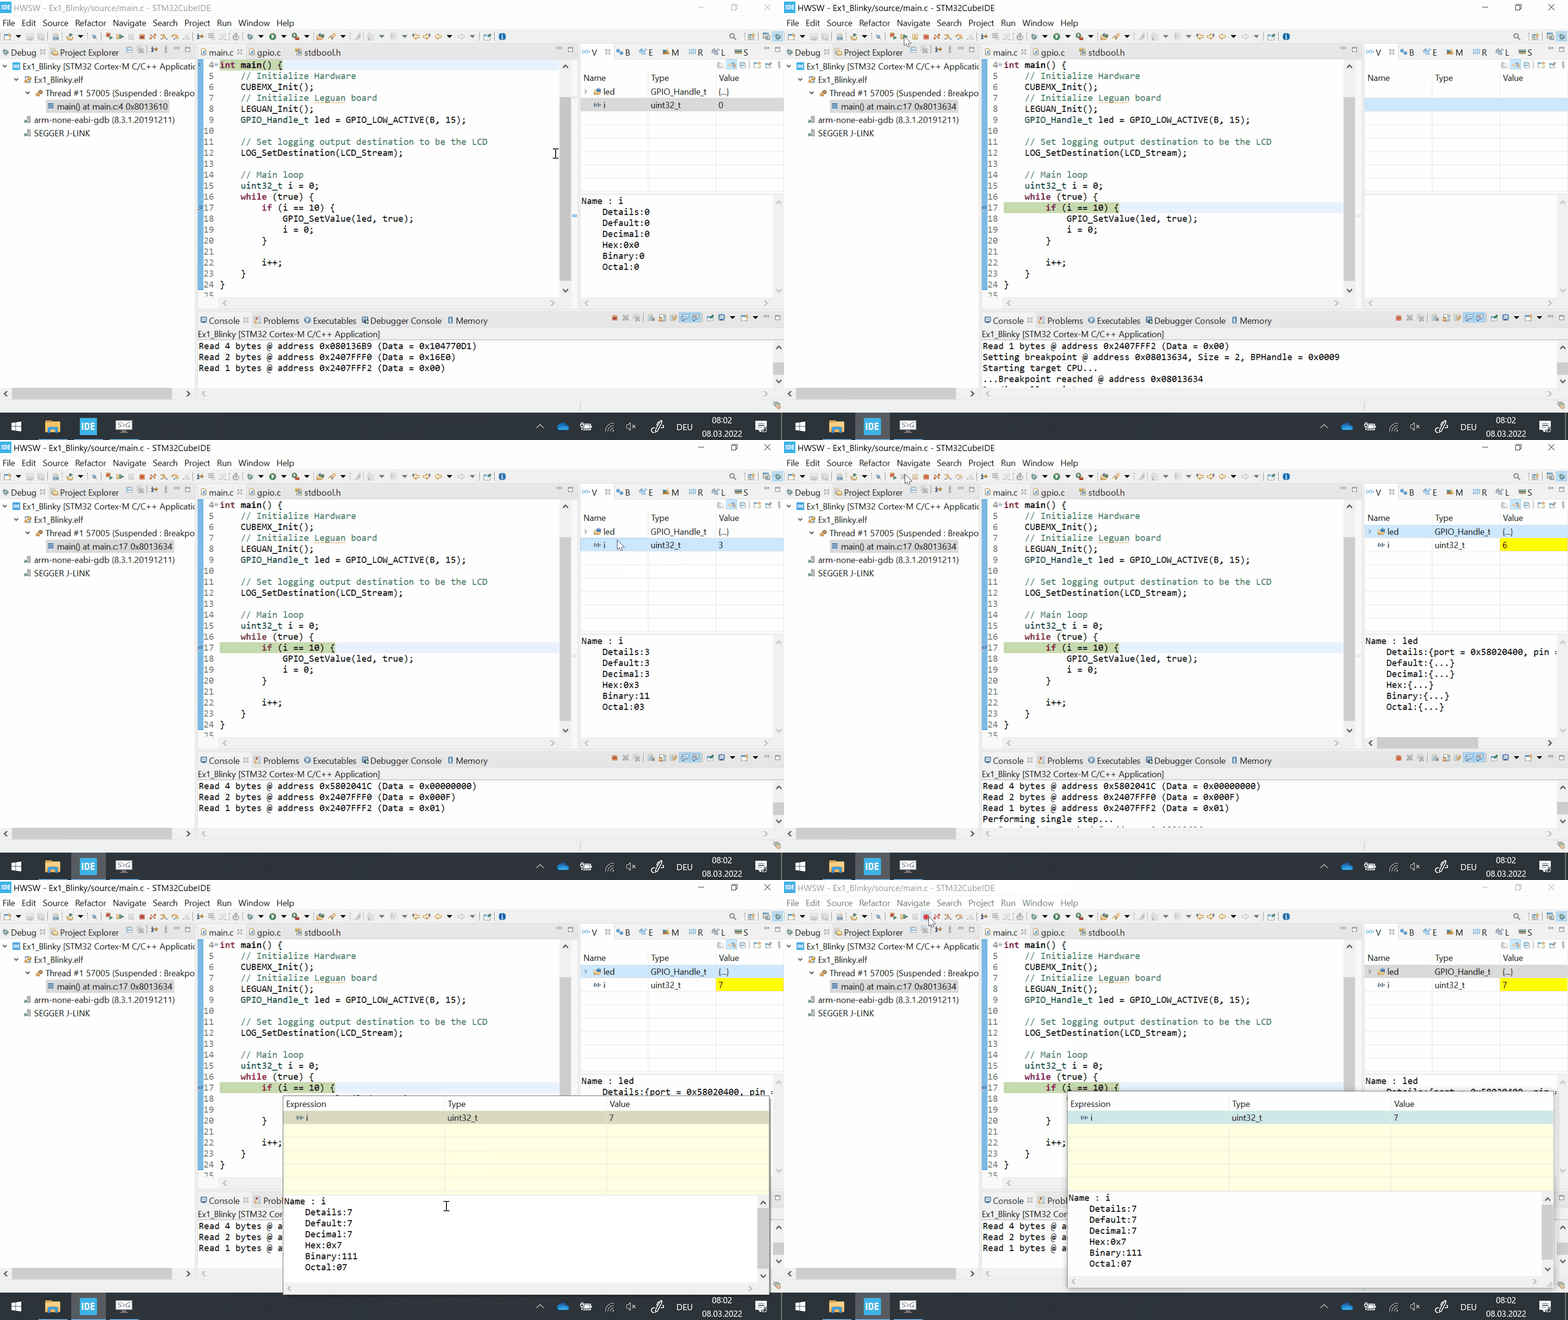
Yellow cells denote a change since the last halt.
../_images/cubeide_debug_variables.gif

You can inspect CPU and special function registers in the Registers and SFR tabs respectively.

Note
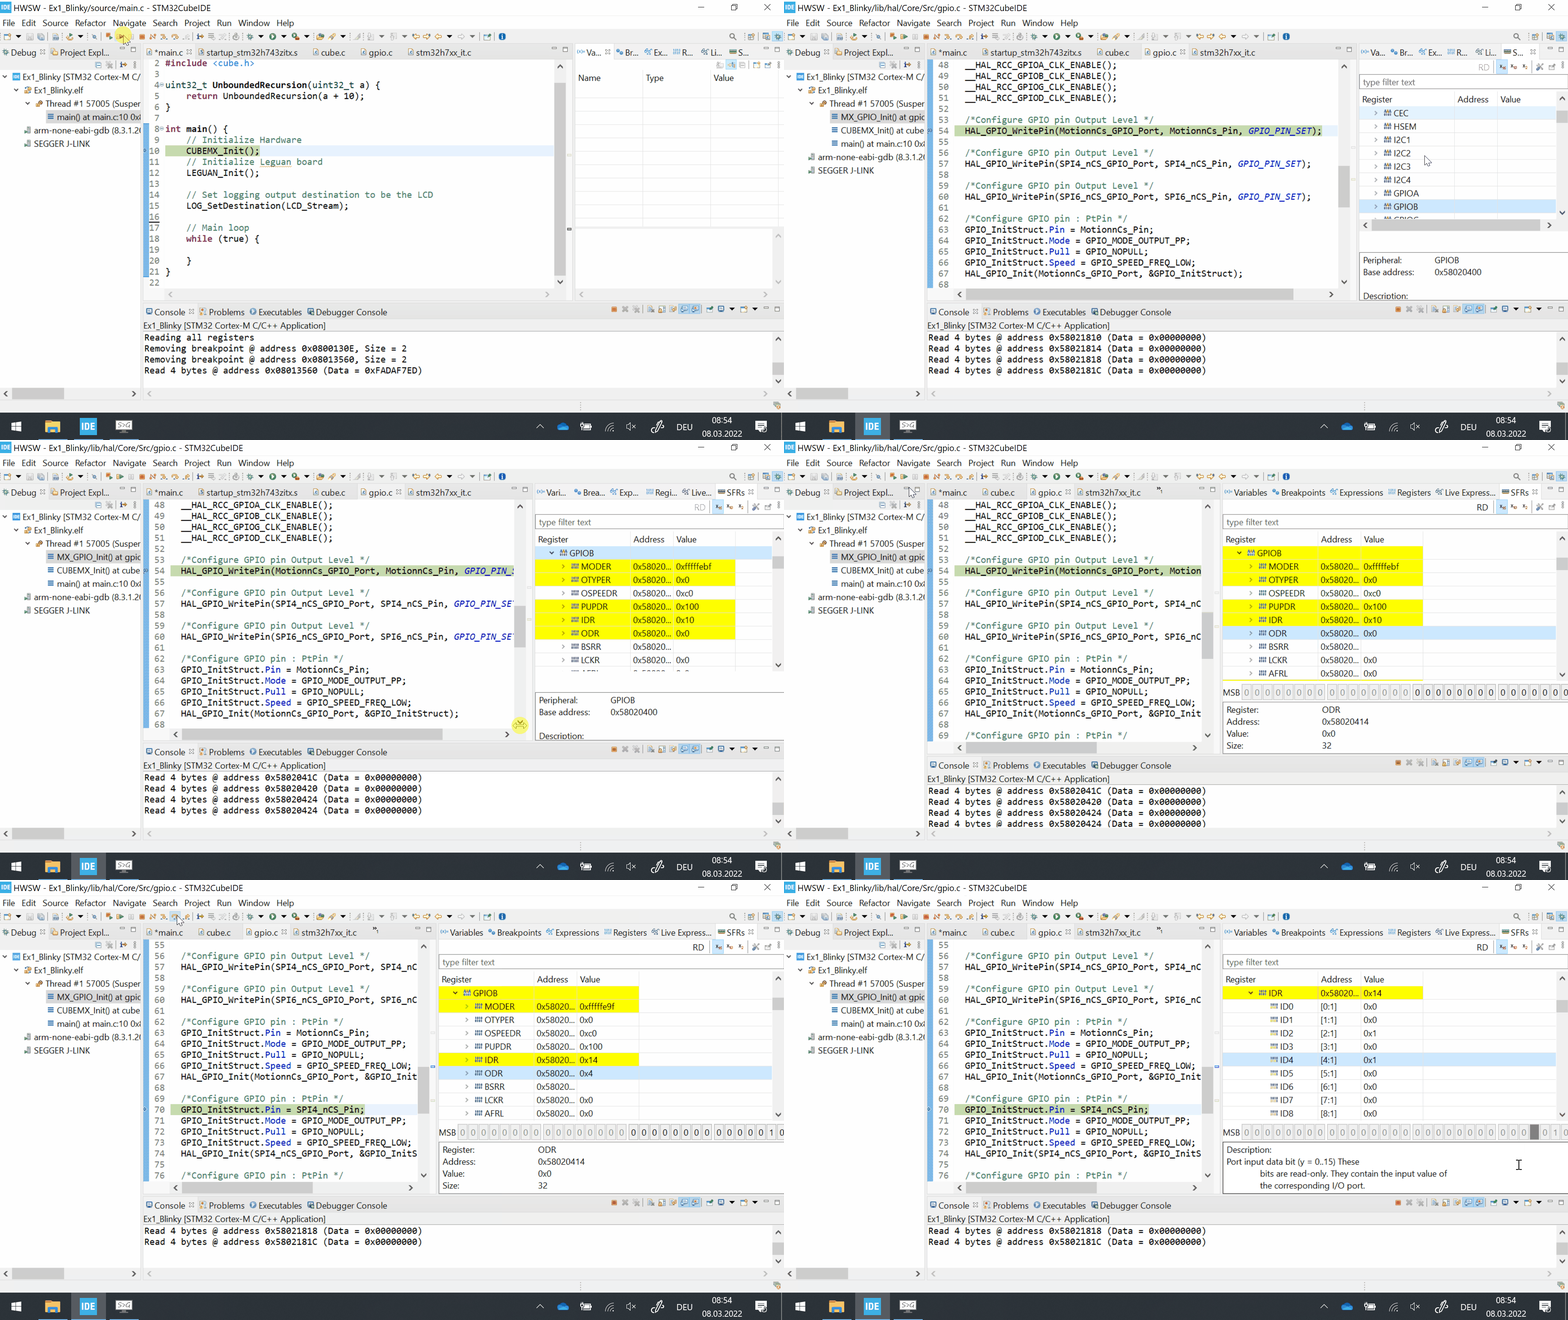
The SRF view show individual bits, documentation and values in multiple numeral systems.
../_images/cubeide_debug_sfr.gif

Code changes while debugging

If you edit code in an active debug session, you will need to recompile the program and restart the debug session.

Note
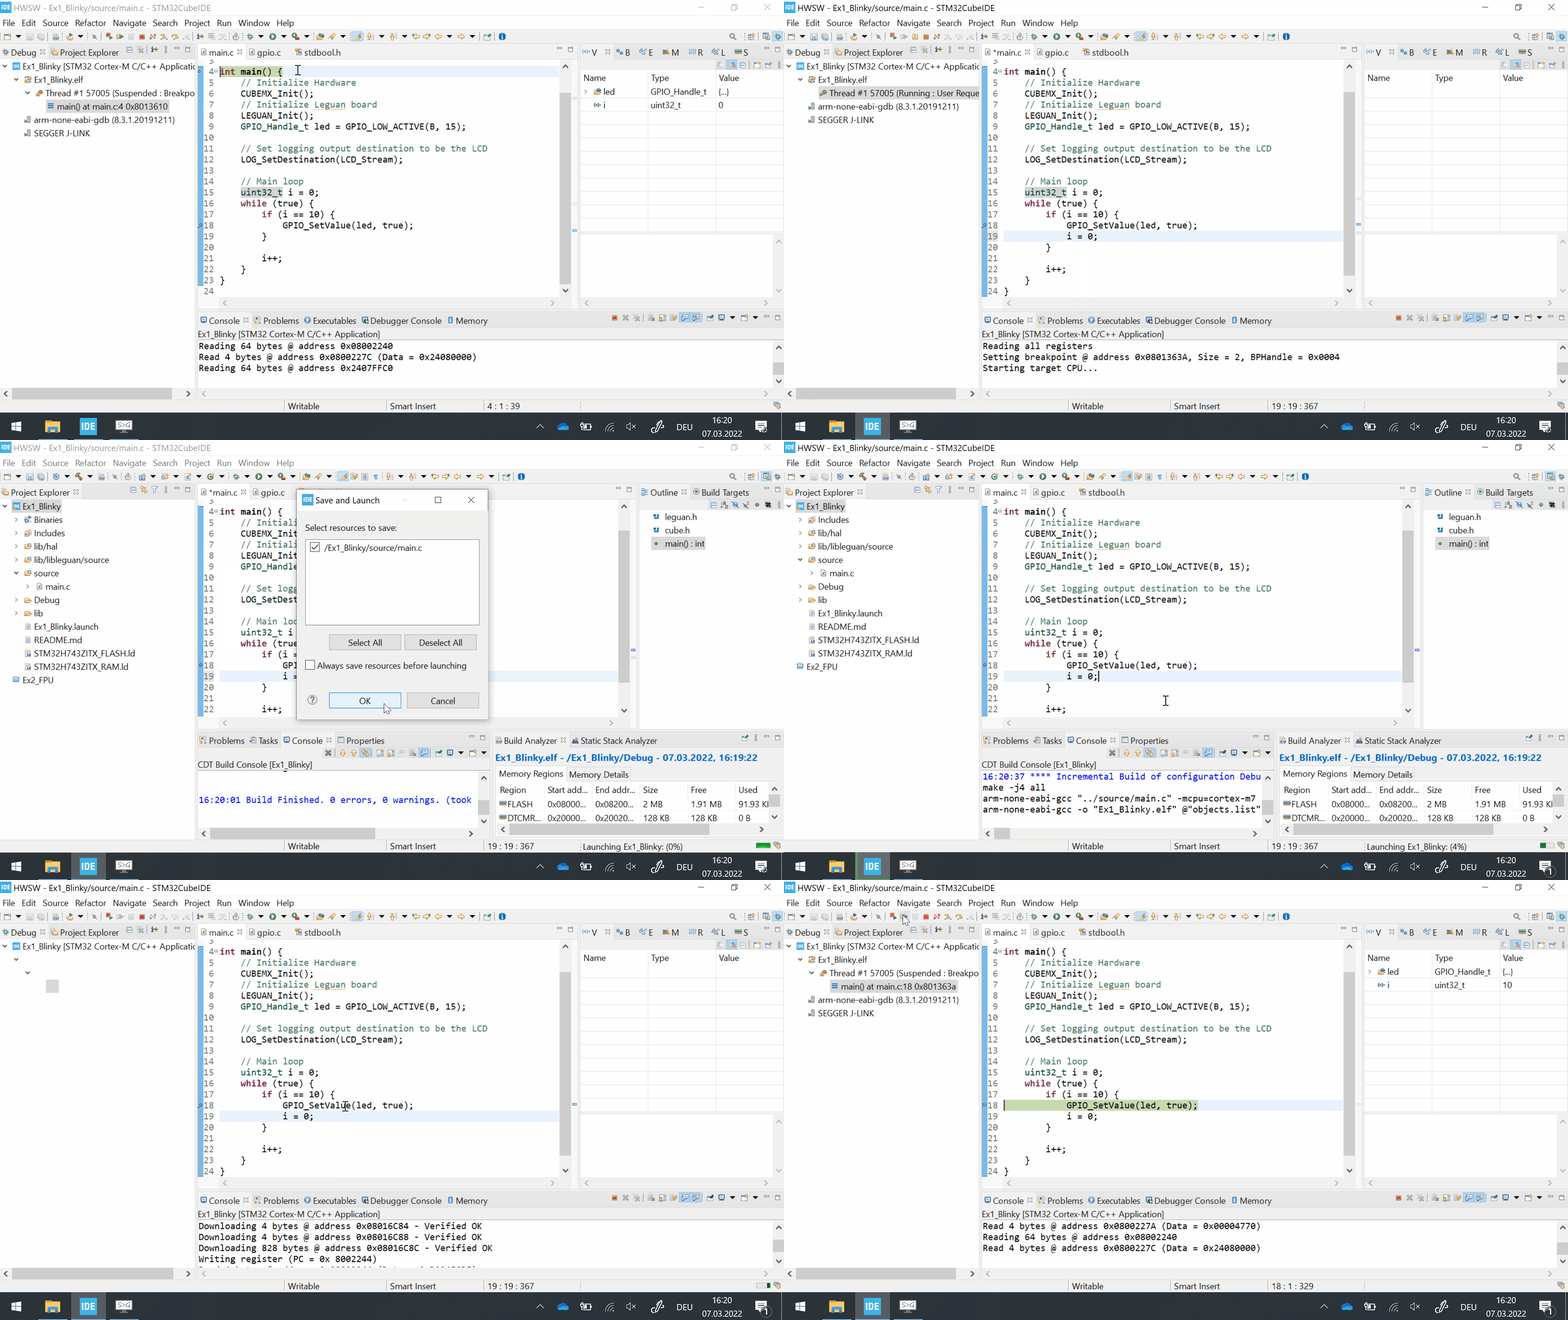
If the compiler tells you Errors exist in the active configuration of project “[xy]”. Proceed with launch?, do not proceed and fix the errors instead.
../_images/cubeide_debug_relaunch.gif

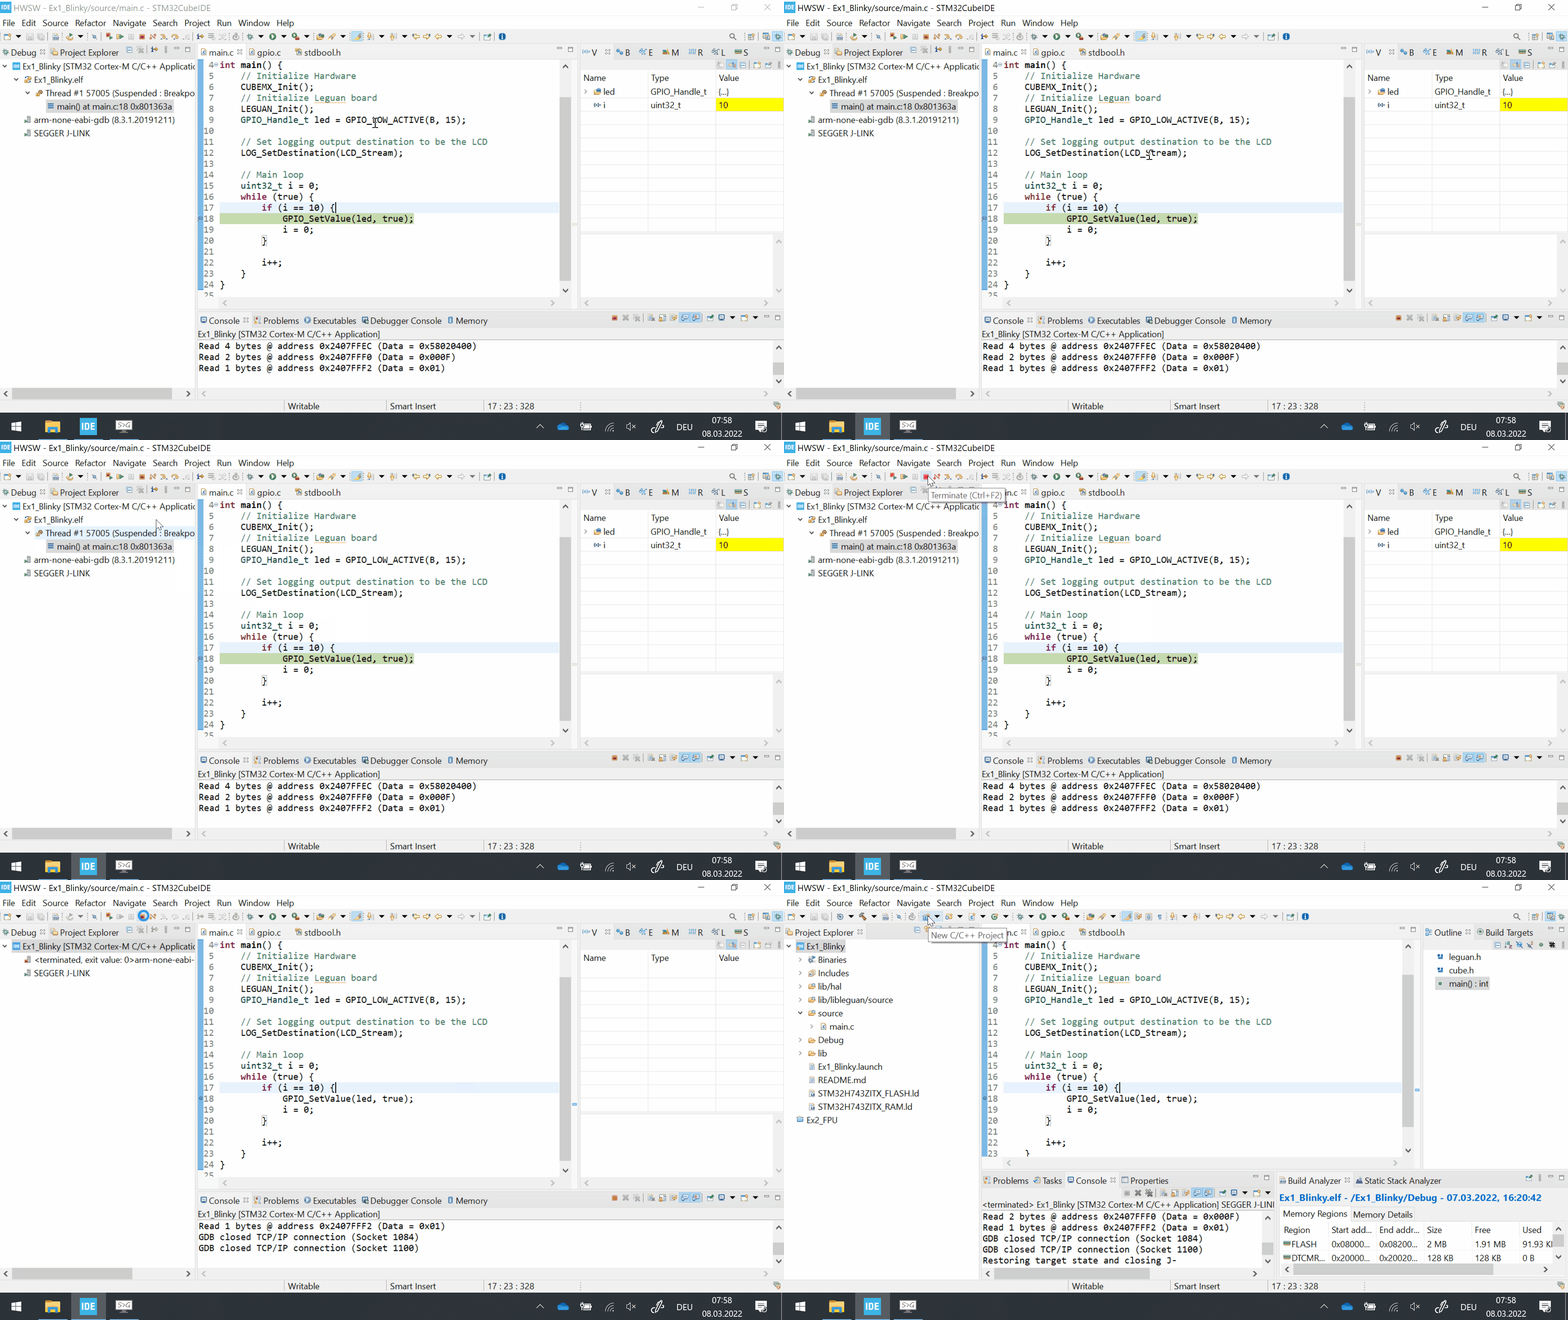
End debug session

Stop the debug session and go back to the editor view.

../_images/cubeide_debug_end.gif